Google Keyword Planner (GKP) is a free tool from Google that helps marketers understand the search demand and competitive landscape for their niche. We will be discussing step by step how to use Google Keyword Planner to build a campaign for SEO. Although GKP is designed to be used with a Google Ads campaign, the data is valuable to anyone who needs to understand search, especially SEO’s. I believe this tool is best used by beginner and entry level marketer’s because other paid tools can help marketers explore search data more effectively.
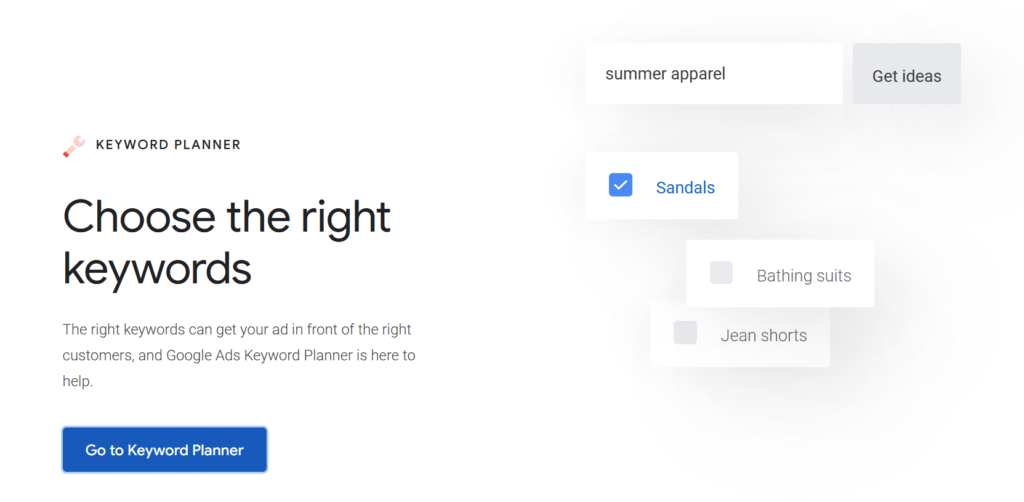
Log in to GKP
There are two tools to choose from “Discover new Keywords” and “Get Search Volume and Forecasts”. We’ll be looking at the “discover new keywords” tool.
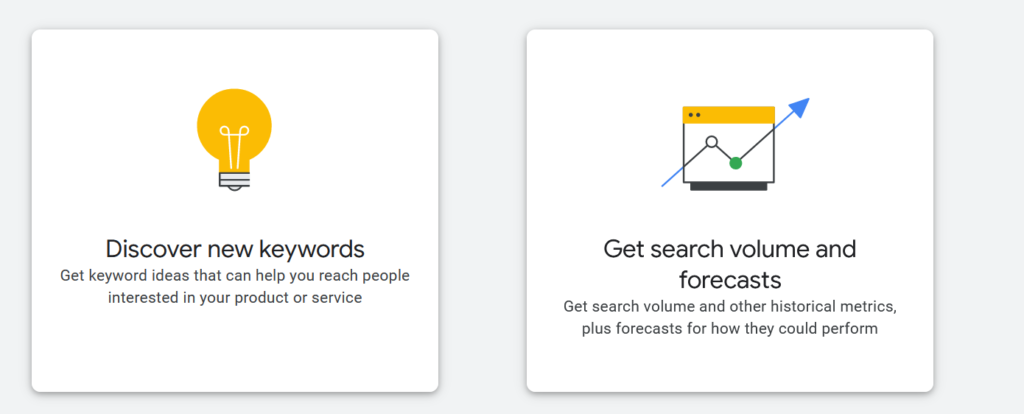
Use the ‘Discover new keywords’ tool
Depending on where you are in your optimization journey, you’ll either be starting with very specific keywords or very general ones. My advice is to start with something general and narrow your list of keywords down to more specific ones. Let’s pretend that we are working on a recipe blog about all kinds of cookies. We’ll start by putting cookies into the search.

Here’s a quick breakdown of some of the metrics you’ll encounter in this report.
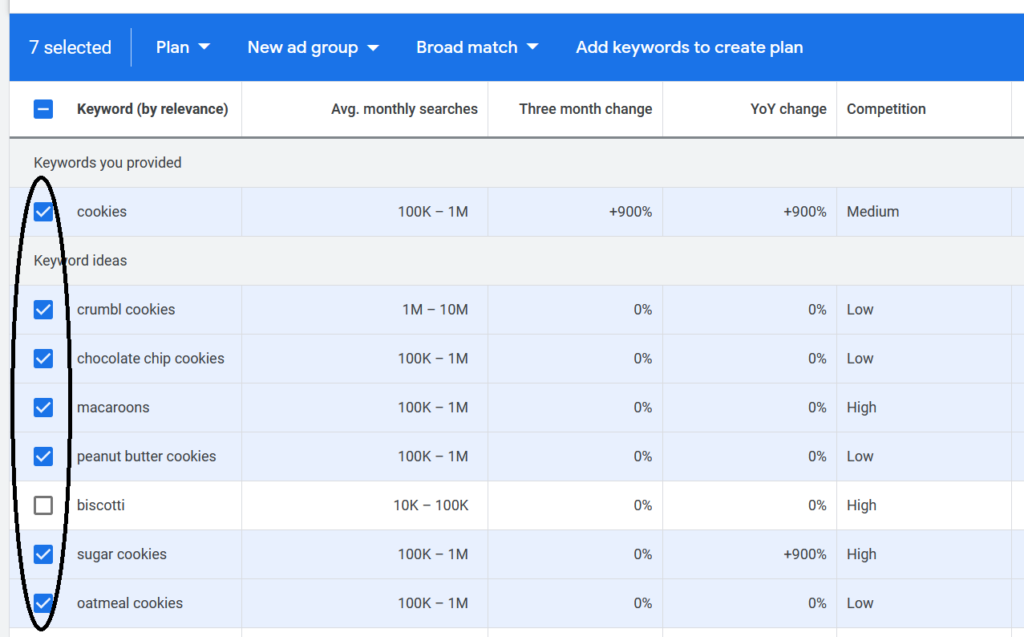
Keyword by Relevance shows what Google believes are relevant keywords to the first keyword(s) you entered into the tool. Browsing through this list is especially helpful, although depending on how specific you are there may be too many relevant or irrelevant keywords.
Avg. monthly searches show how many times a particular keyword is searched within the given time frame. Note that Google will give you a range for any given keyword. Some of these ranges are particularly broad. Once you start earning page 1 positions for your keywords, you can get a more accurate view of the number of times a keyword is search from Google Search Console. You’ll also be able to see more specific numbers by exporting the data, which we’ll cover below.
Three month change shows how much the searches for a given keyword have increased or decreased over the last 3 months. In this case, it looks like searches for cookies has increased 900% in the last 3 months.
YoY change shows how much the searches for a given keyword have increased or decreased with in a year.
Competition is a reflection of the competitive landscape for Adwords. Remember that this tool is designed to work within Ad Campaigns. These results are not indicative of organic search (SEO) competition, but they are often very similar–if a keyword is valuable enough to bid on, it’s valuable enough to optimize for.
Ad impression share shows what percent of the searches for a given keyword your ad is shown. This metric is more important for Ad Marketers than SEO’s.
Top of page bid shows what other marketers are paying to show at the top of any given keyword’s search results. Again this is more important for paid search marketers.
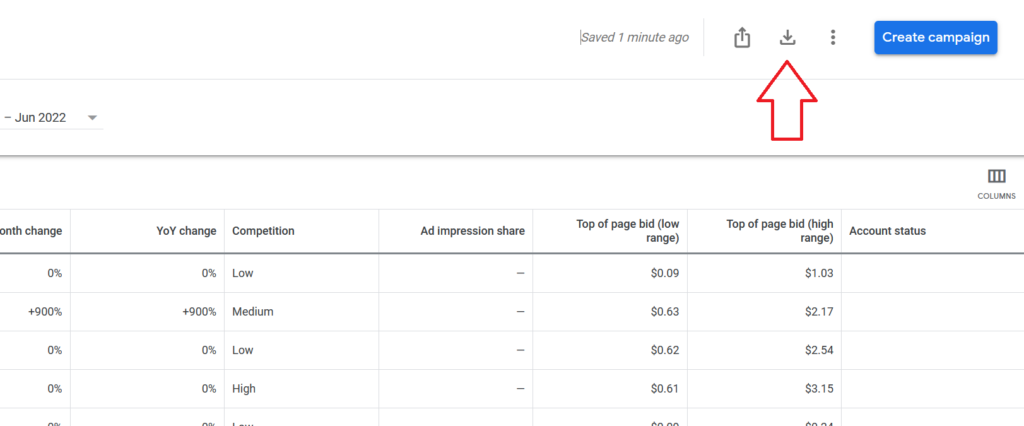
I suggest selecting the keywords you’d like to work towards and exporting them. Here’s how to do that:

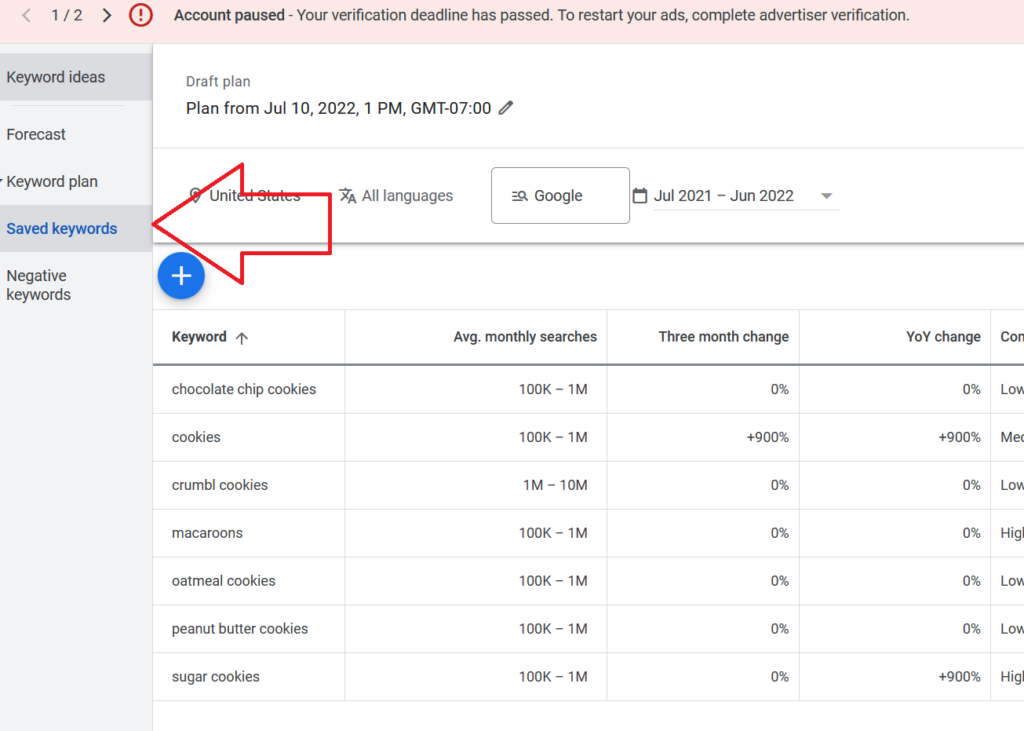
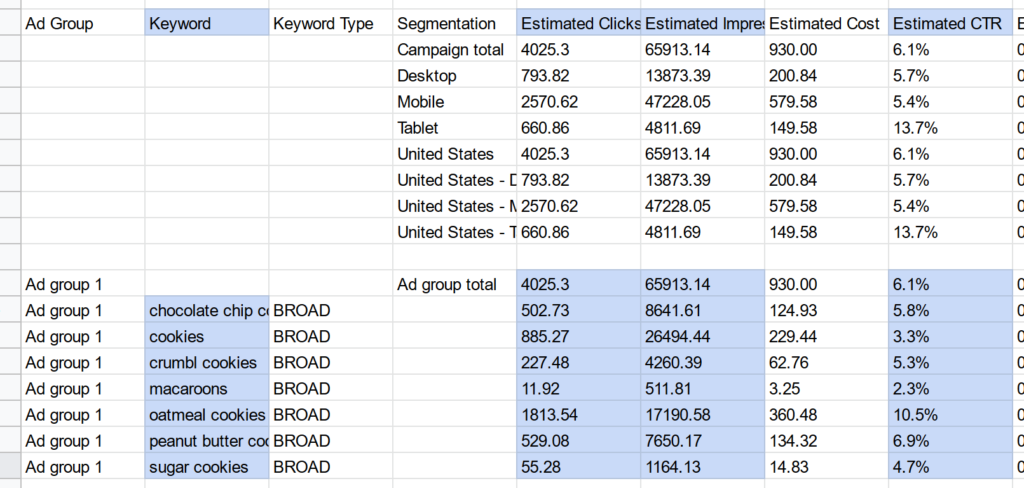
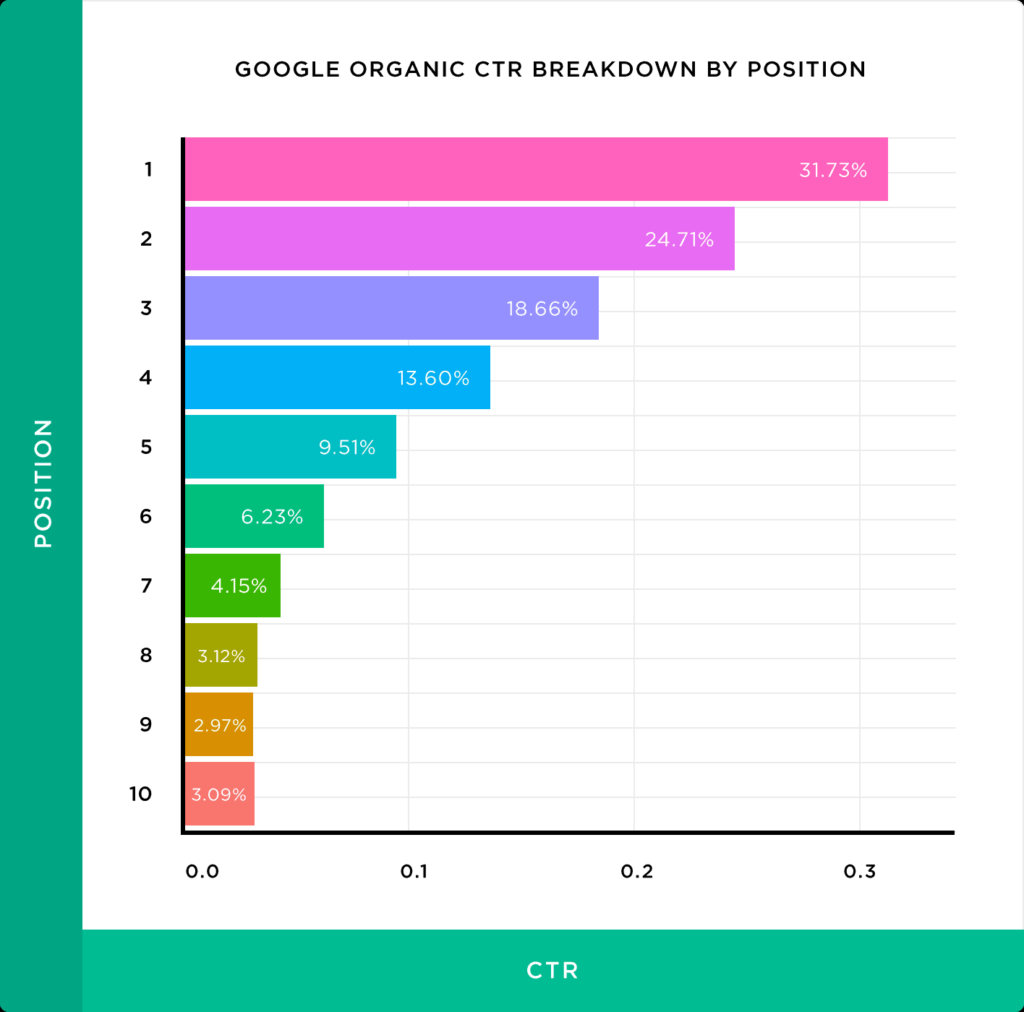
I’ve highlighted in blue the more important cells to take note of. The keyword column shows the keywords that you selected. Estimated clicks and impressions are based off the faux campaign you created. This report will give you a more accurate idea of how much search volume there is, as well as how much search volume you can earn on page one. Backlinko did a good study on how much click through rate each position earns. Here’s a graphic they developed.
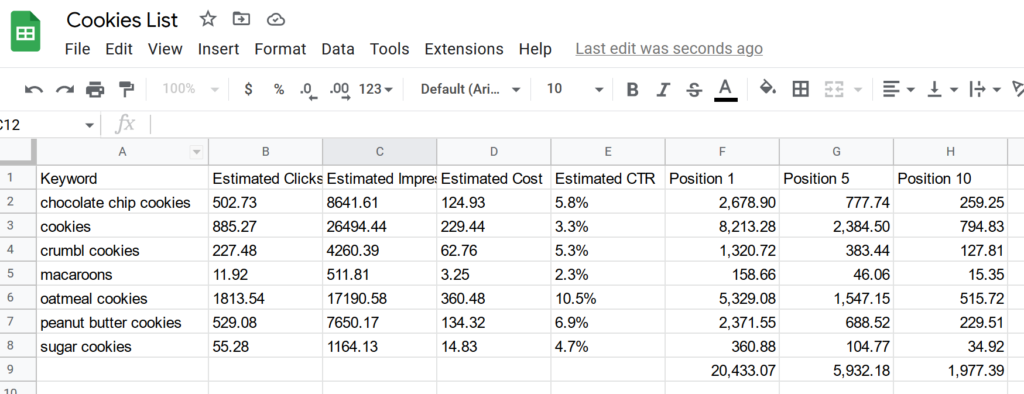
Here I took the keywords and click through rate and created basic formulas to show how much traffic I can earn in each position. Here are the formulas:
Position 1 =C2*0.31
Position 5 =C2*0.09
Position 10 =C2*0.03
You can even calculate the sum of each column to show best, average, and worst case scenarios on page 1.
By creating a keyword map in this way, you can quickly show the potential your campaign will have. This is good for sharing with any teammates who work on your website, your boss, your client, and any content writers who may be developing content for your site.